Let's draw the Velocity versus Time graph:
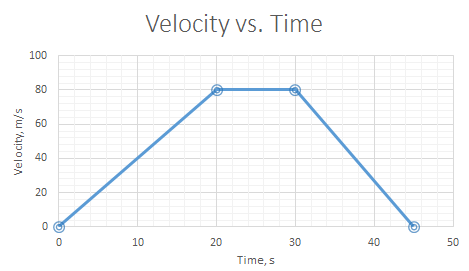
(a) The area under the Velocity vs. Time graph represents the total distance covered. Let's find the area under the graph:
d1=Arealeft triangle=21bh=21×20 s×80 sm=800 m,d2=Arearectangle=ab=10 s×80 sm=800 m,d3=Arearight triangle=21bh=21×15 s×80 sm=600 m,dtot=d1+d2+d3=800 m+800 m+600 m=2200 m.(b) The average speed can be found as follows:
vavg=ttotdtot=45 s2200 m=48.9 sm.(c) We can find the acceleration of the body from the slope of the Velocity vs. Time graph:
a=Slope=ΔxΔy=20 s−0 s80 sm−0 sm=4.0 s2m.(d) We can find the retardation of the body from the slope of the Velocity vs. Time graph:
a=Slope=ΔxΔy=45 s−30 s0 sm−80 sm=−5.33 s2m.The sign minus means that the body decelerates.


Comments