MonthlyExpenses(S $)Frequency(f)Midpoint(x) f⋅x 0 −150 5 75 375 150 −300 8 225 1800 300 −450 15 375 5625 450 −600 9 525 4725 600 −750 17 675 11475 750 −900 6 825 4950 ∑f⋅x=
=375+1800+5625+4725+11475+4950=28950
x=n∑f⋅x=6028950=482.5
To find Median Class
value of (2n)th observation==value of (260)th observation==value of (30)th observation From the column of frequency f, we find that the 30th observation lies in the class 450 −600.
The median class is 450 −600.
Cumulative frequency of the class preceding the median class is 5+8+15=28.
Frequency of the median class is 9.
Class length of median class is 150.
median=450+930−28⋅150≈483.3333To find Mode Class
Here, maximum frequency is 17.
The mode class is 600 −750.
Lower boundary point of mode class =600.
Frequency of the mode class =17.
Frequency of the preceding class =9.
Frequency of the succedding class =6.
Class length of mode class =150.
mode=600+2⋅17−9−617−9⋅150=663.1579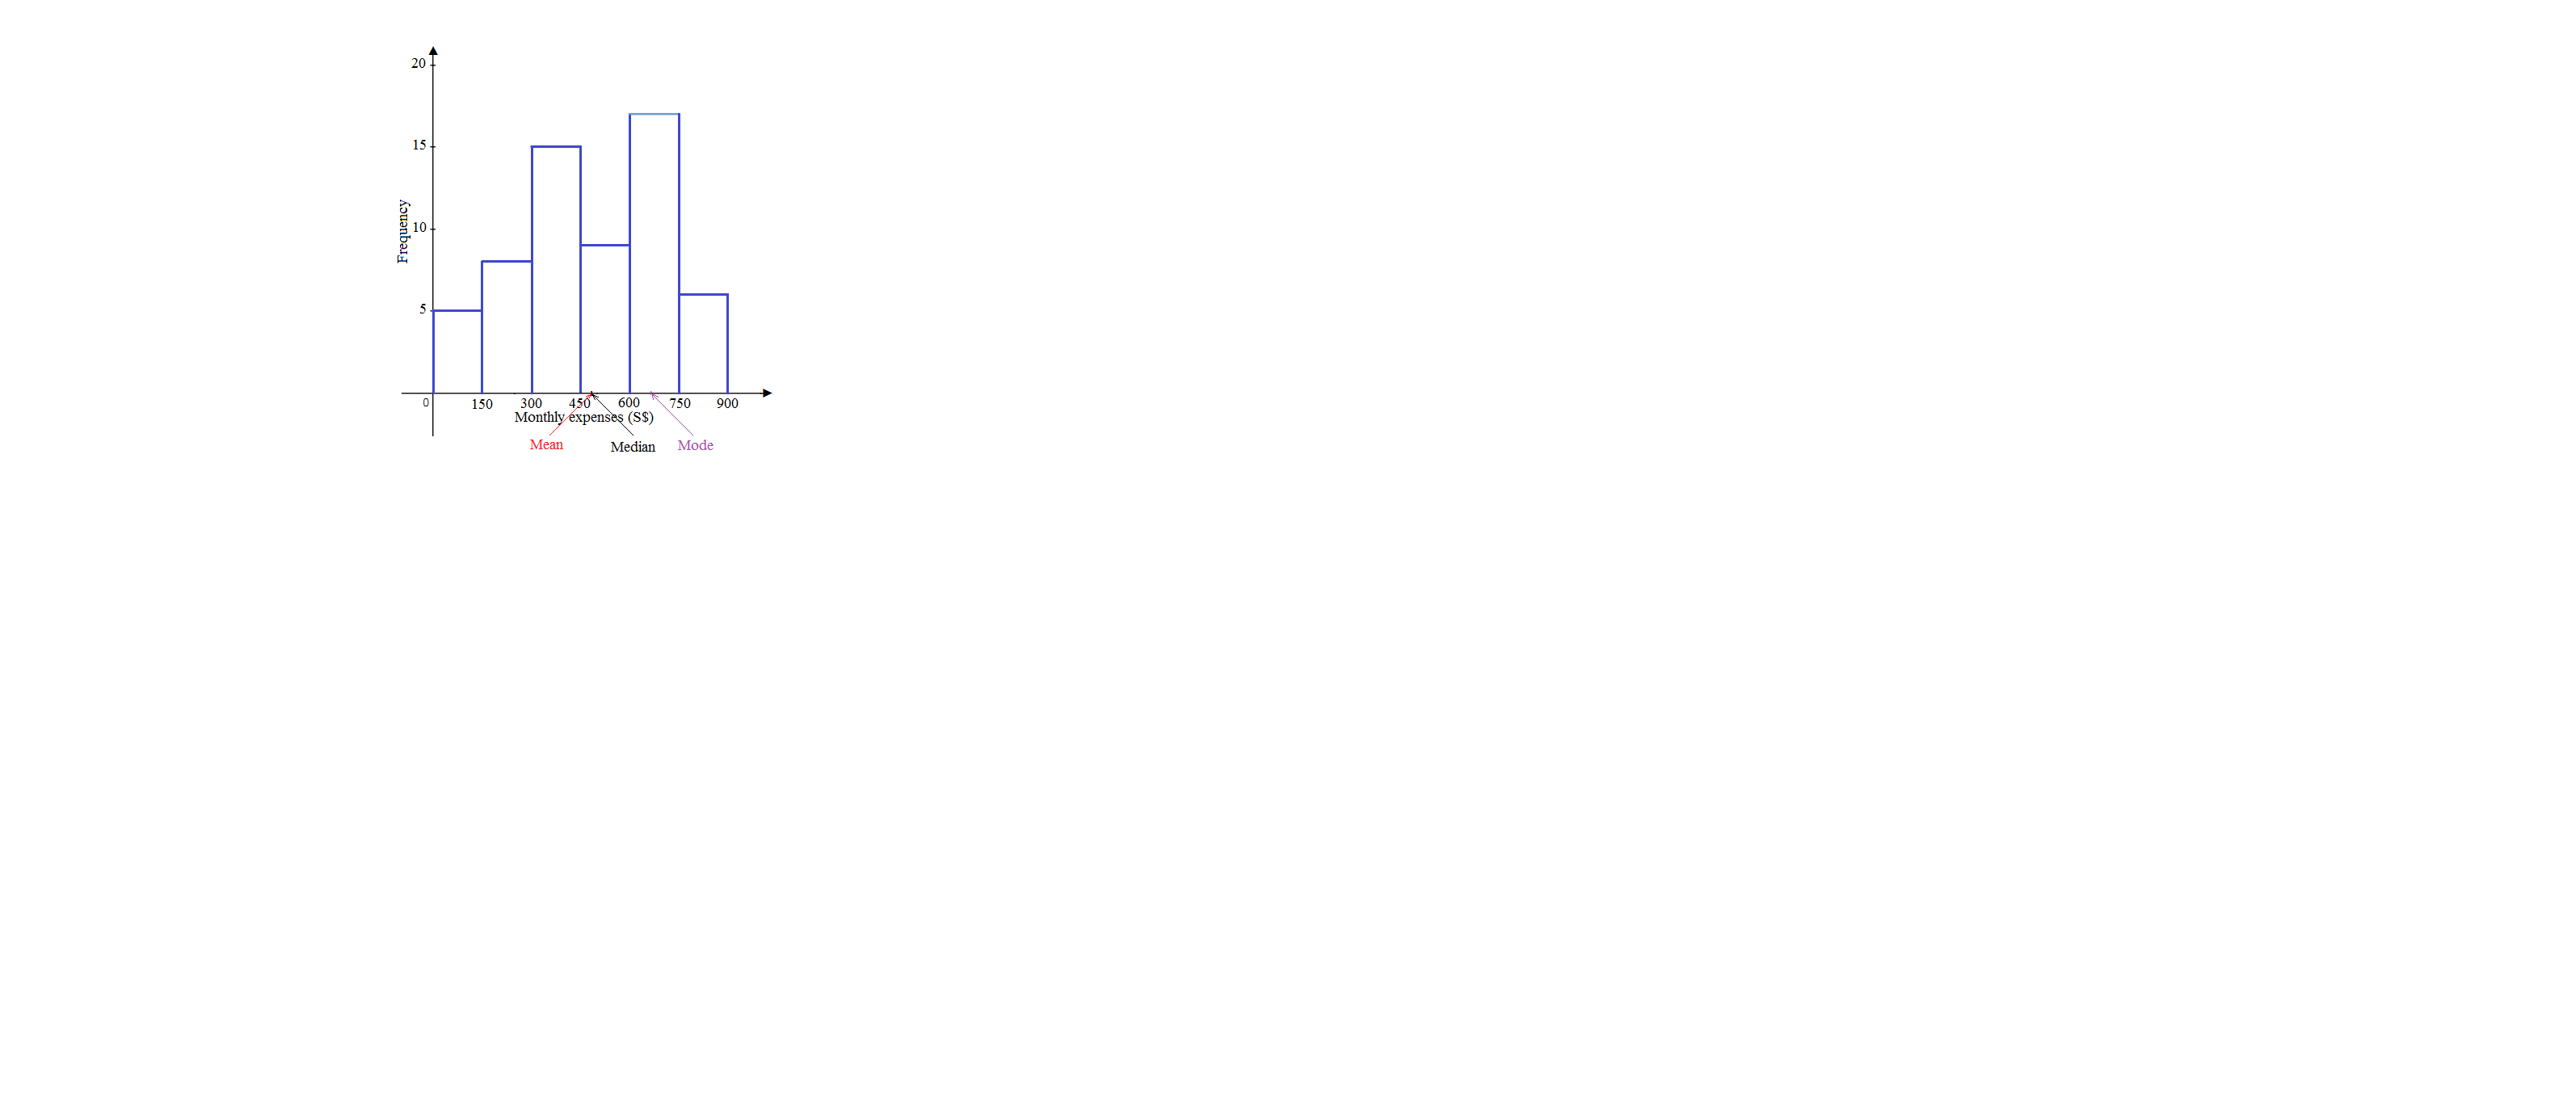 mean<median<mode
The monthly expenses distribution is A left-skewed distribution. But the mean and median are close together. They are approximately equal.
The mode is greater than mean and then median.
The form of diagram does not help me well.
I may suppose that the data are approximately symmetric.
The mean has one main disadvantage: it is particularly susceptible to the influence of outliers. These are values that are unusual compared to the rest of the data set by being especially small or large in numerical value.
The median is the middle score for a set of data that has been arranged in order of magnitude. The median is less affected by outliers and skewed data.
Normally, the mode is used for categorical data where we wish to know which is the most common category
I think, I would choose the median for the above grouped data.

