Answer on Question #84189 – Math – Statistics and Probability
Question
Plot the following data about demand for an item. Find the moving averages by taking n=3 . Use these to forecast next two months' demand.
Month 1 2 3 4 5 6 7 8 9 10 11 12
Demand 46 56 54 43 57 56 67 62 50 56 47 56
Solution
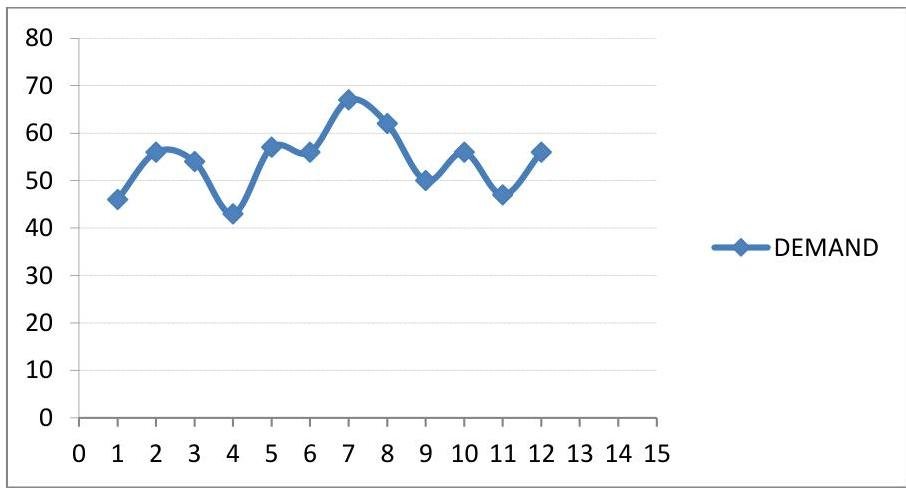
Plot:
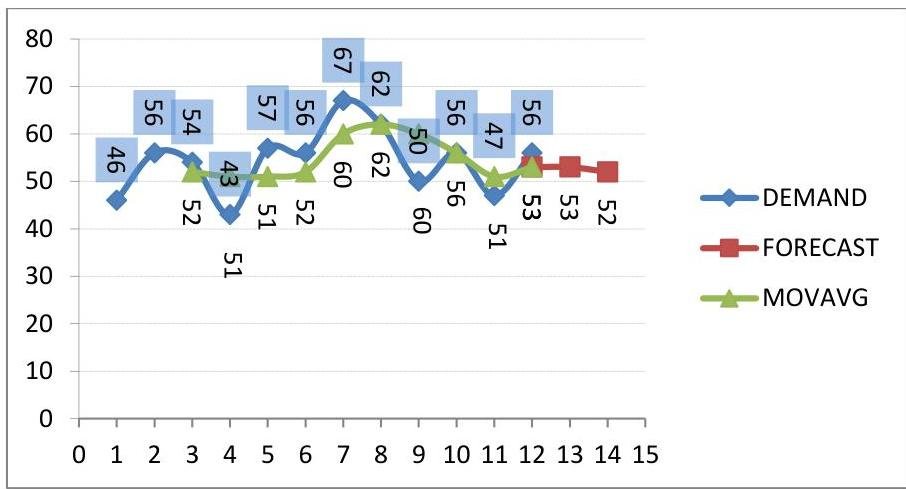
Moving averages:
MA3=(46+56+54)/3=52
MA4=52+(43−46)/3=51
MA5=51+(57−56)/3=51.33…=51
MA6=51+(56−54)/3=51.66…=52
MA7=52+(67−43)/3=60
MA8=60+(62−57)/3=61.66…=62
MA9=62+(50−56)/3=60
MA10=60+(56−67)/3=56.33…=56
MA11=56+(47−62)/3=51
MA12=51+(56−50)/3=53
Forecast:
FC13=(56+51+53)/3=53.33⋯=53FC14=(51+53+53)/3=52.33⋯=52
**Answer:**
Answer provided by https://www.AssignmentExpert.com

