Class limits1−4344−8687−129130−172173−215216−258259−301302−344Frequency2417341001
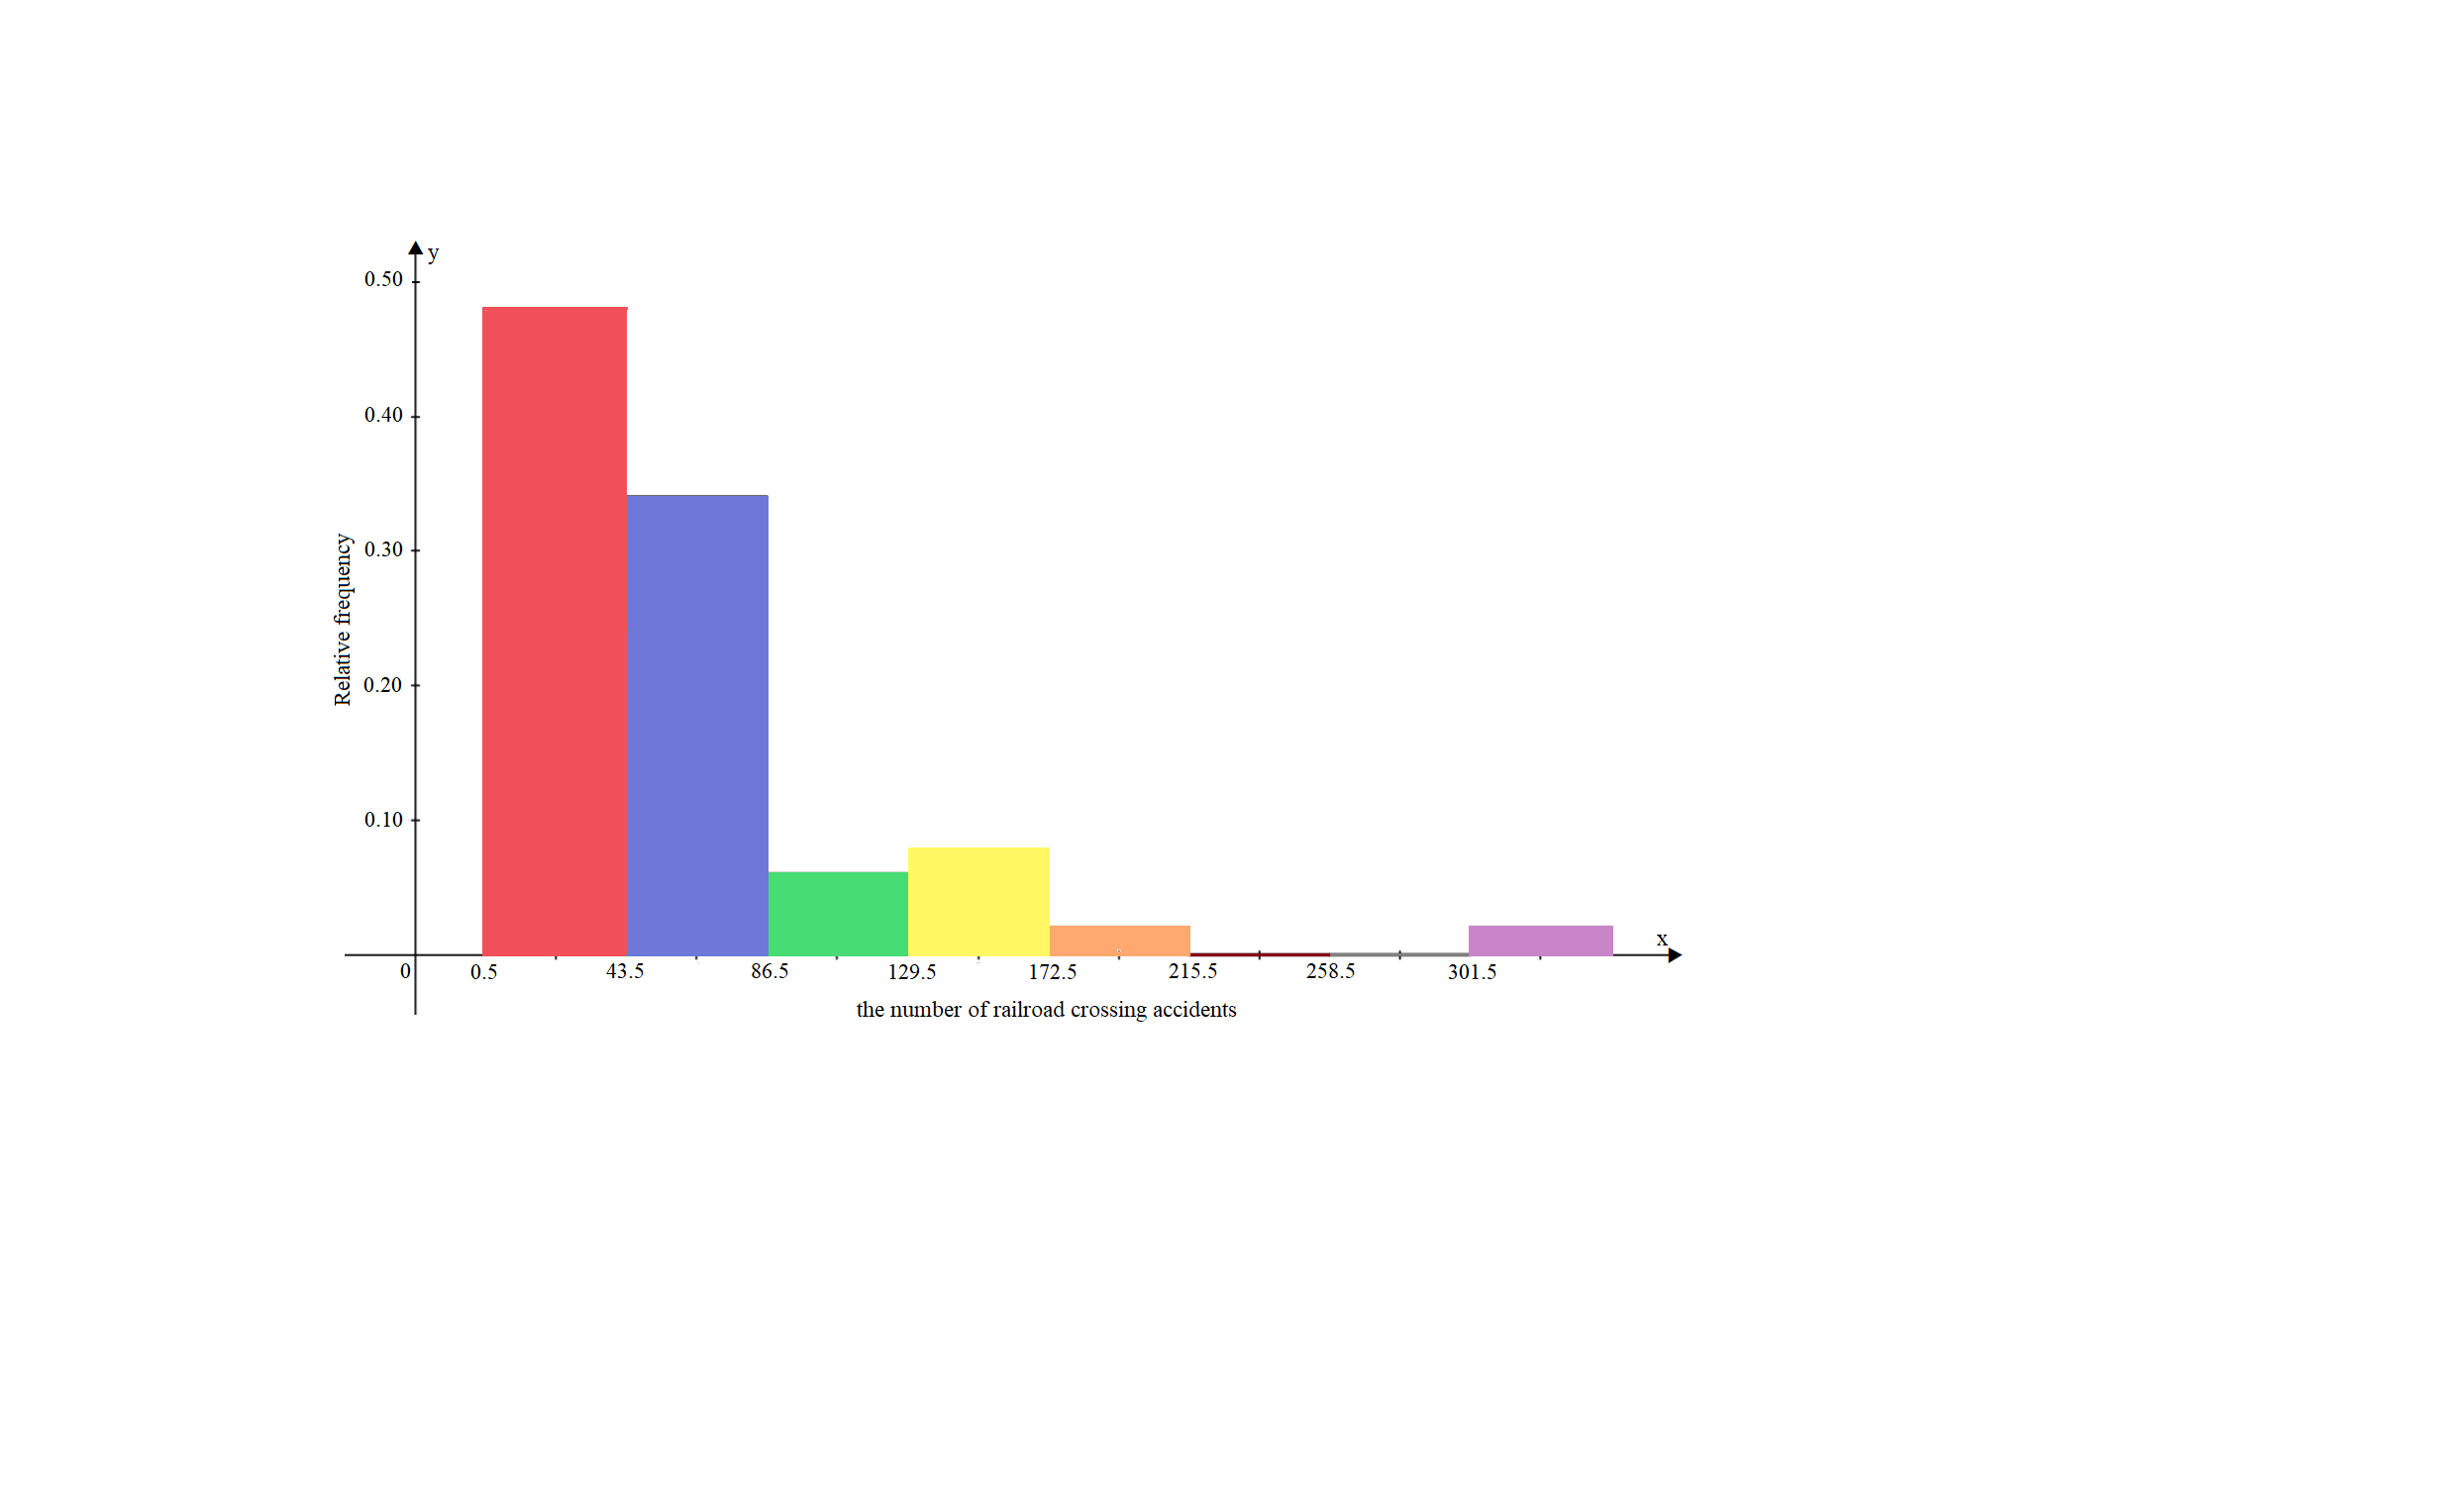
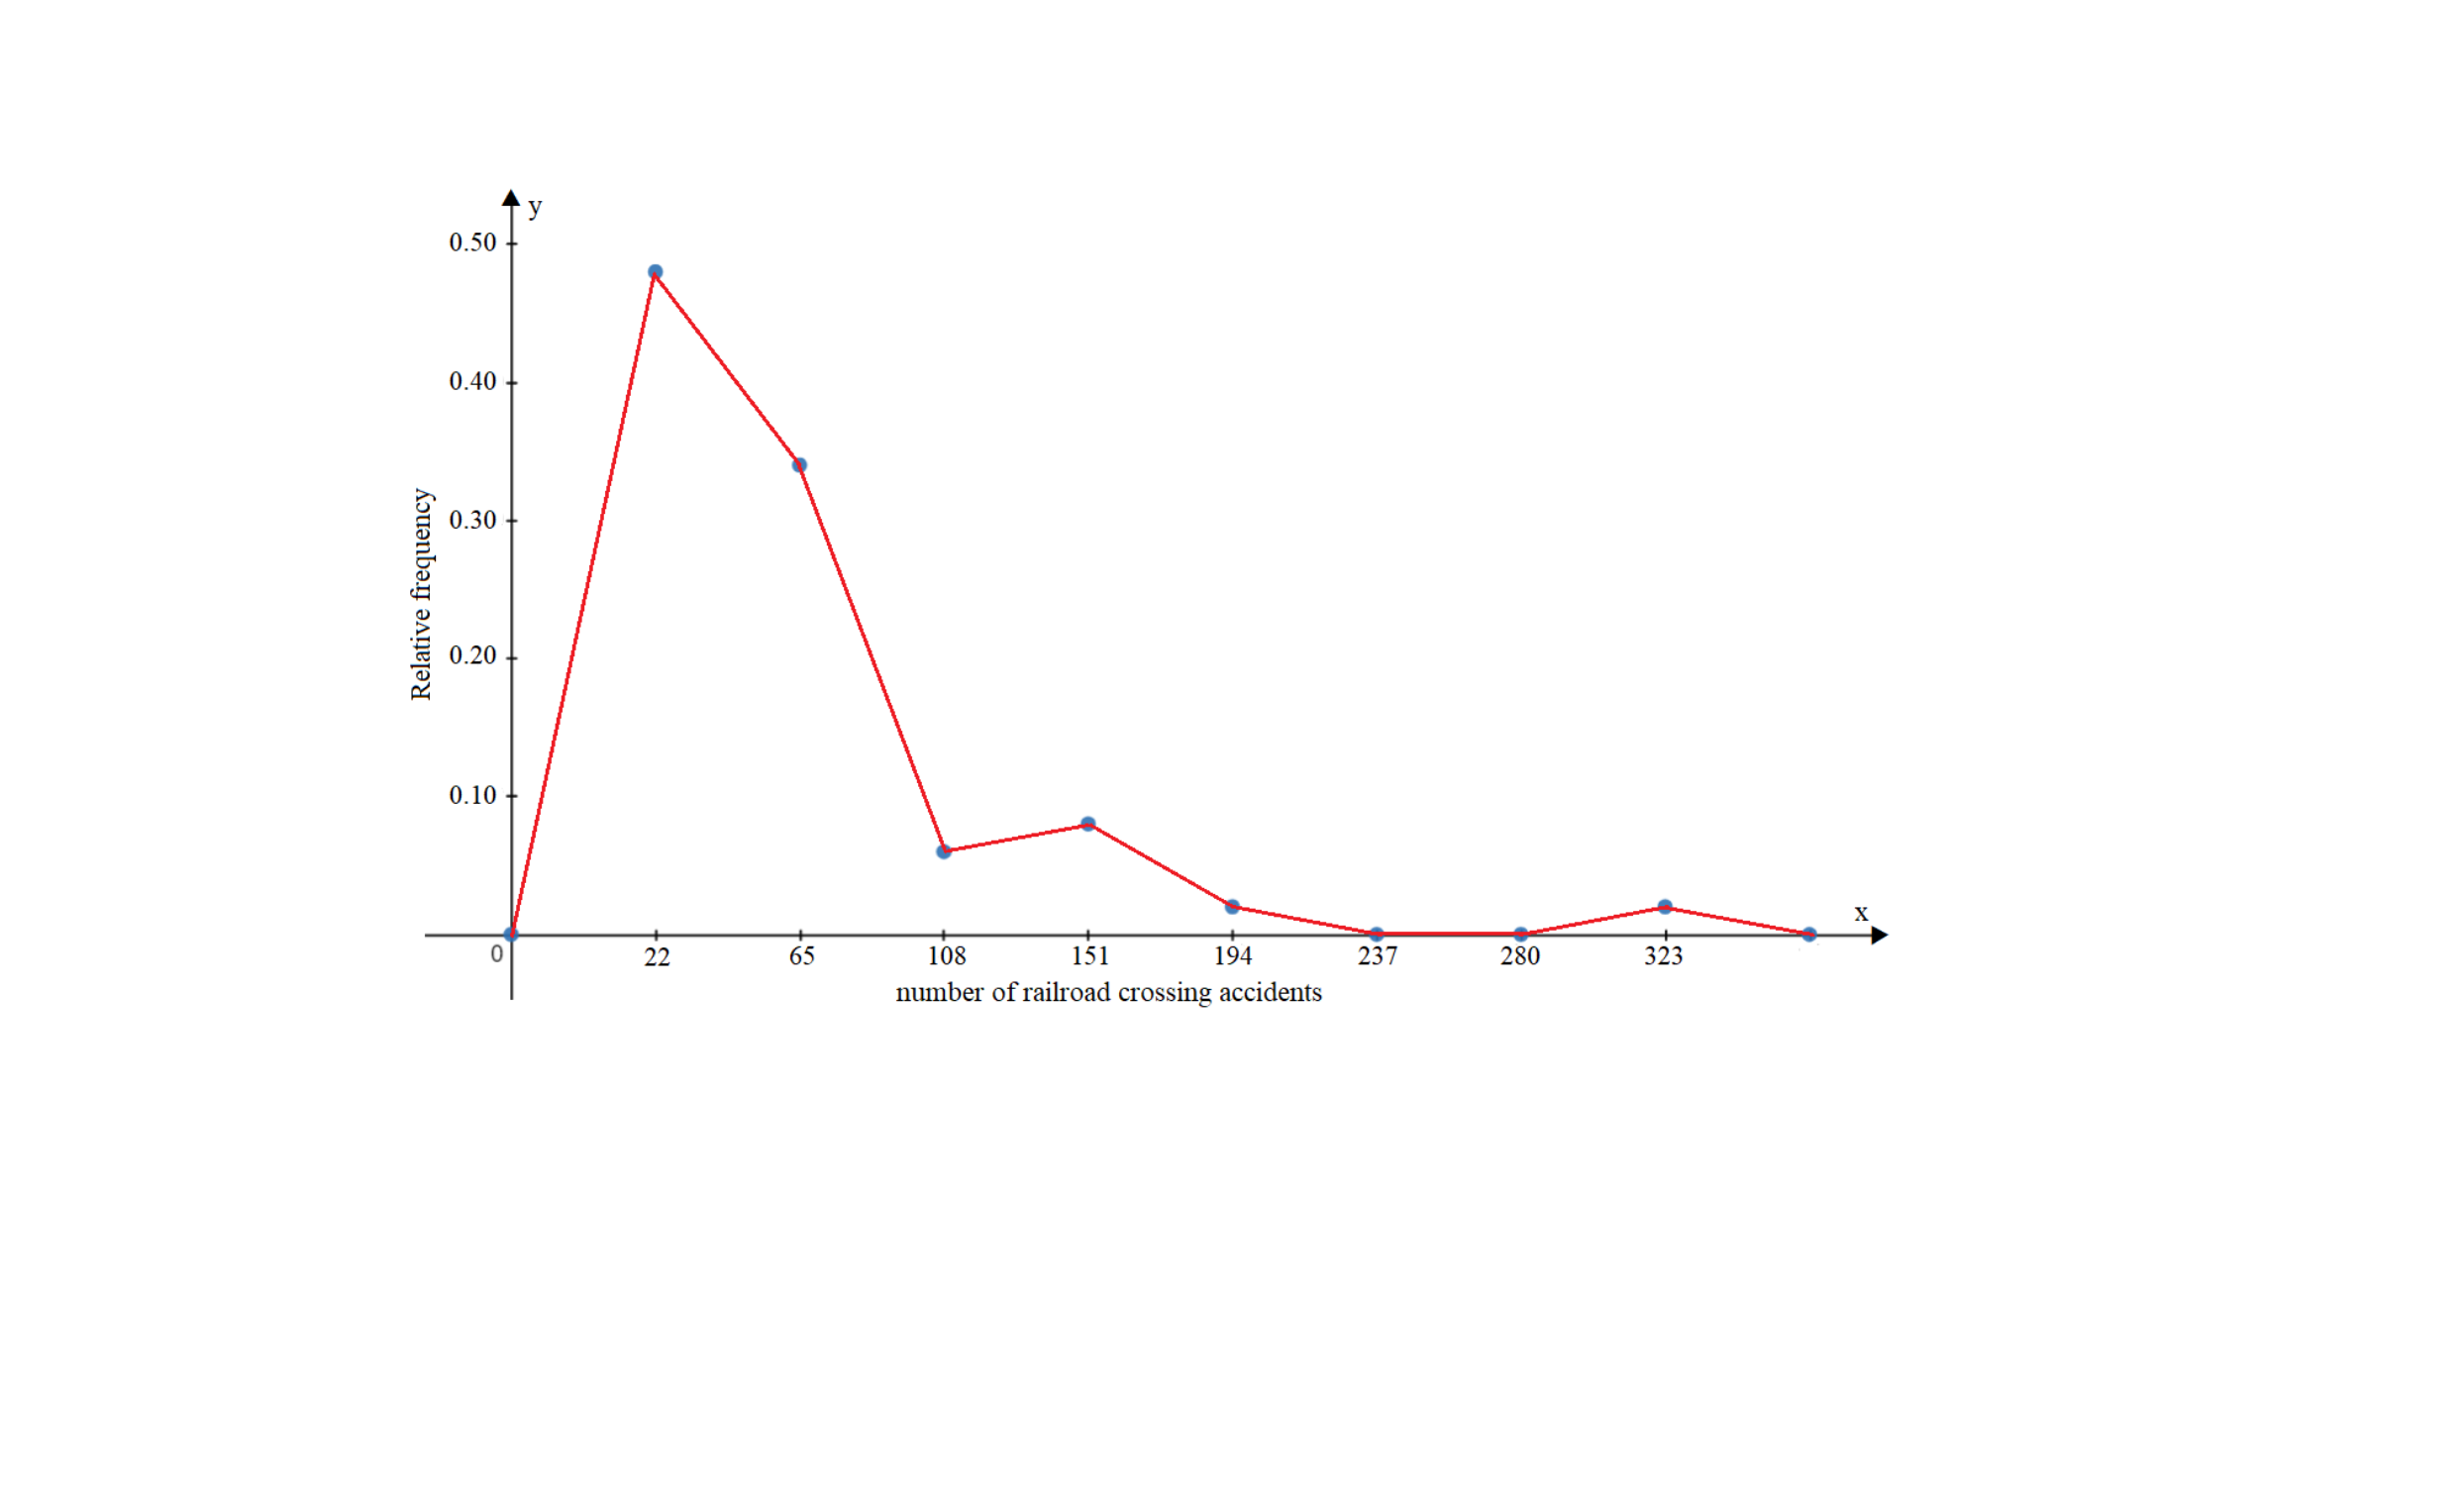
Classlimits1−4344−8687−129130−172173−215216−258259−301302−344Classboundaries0.5−43.543.5−86.586.5−129.5129.5−172.5172.5−215.5215.5−258.5258.5−301.5301.5−344.5Midpoint2265108151194237280323Relativefrequency0.480.340.060.080.02000.02
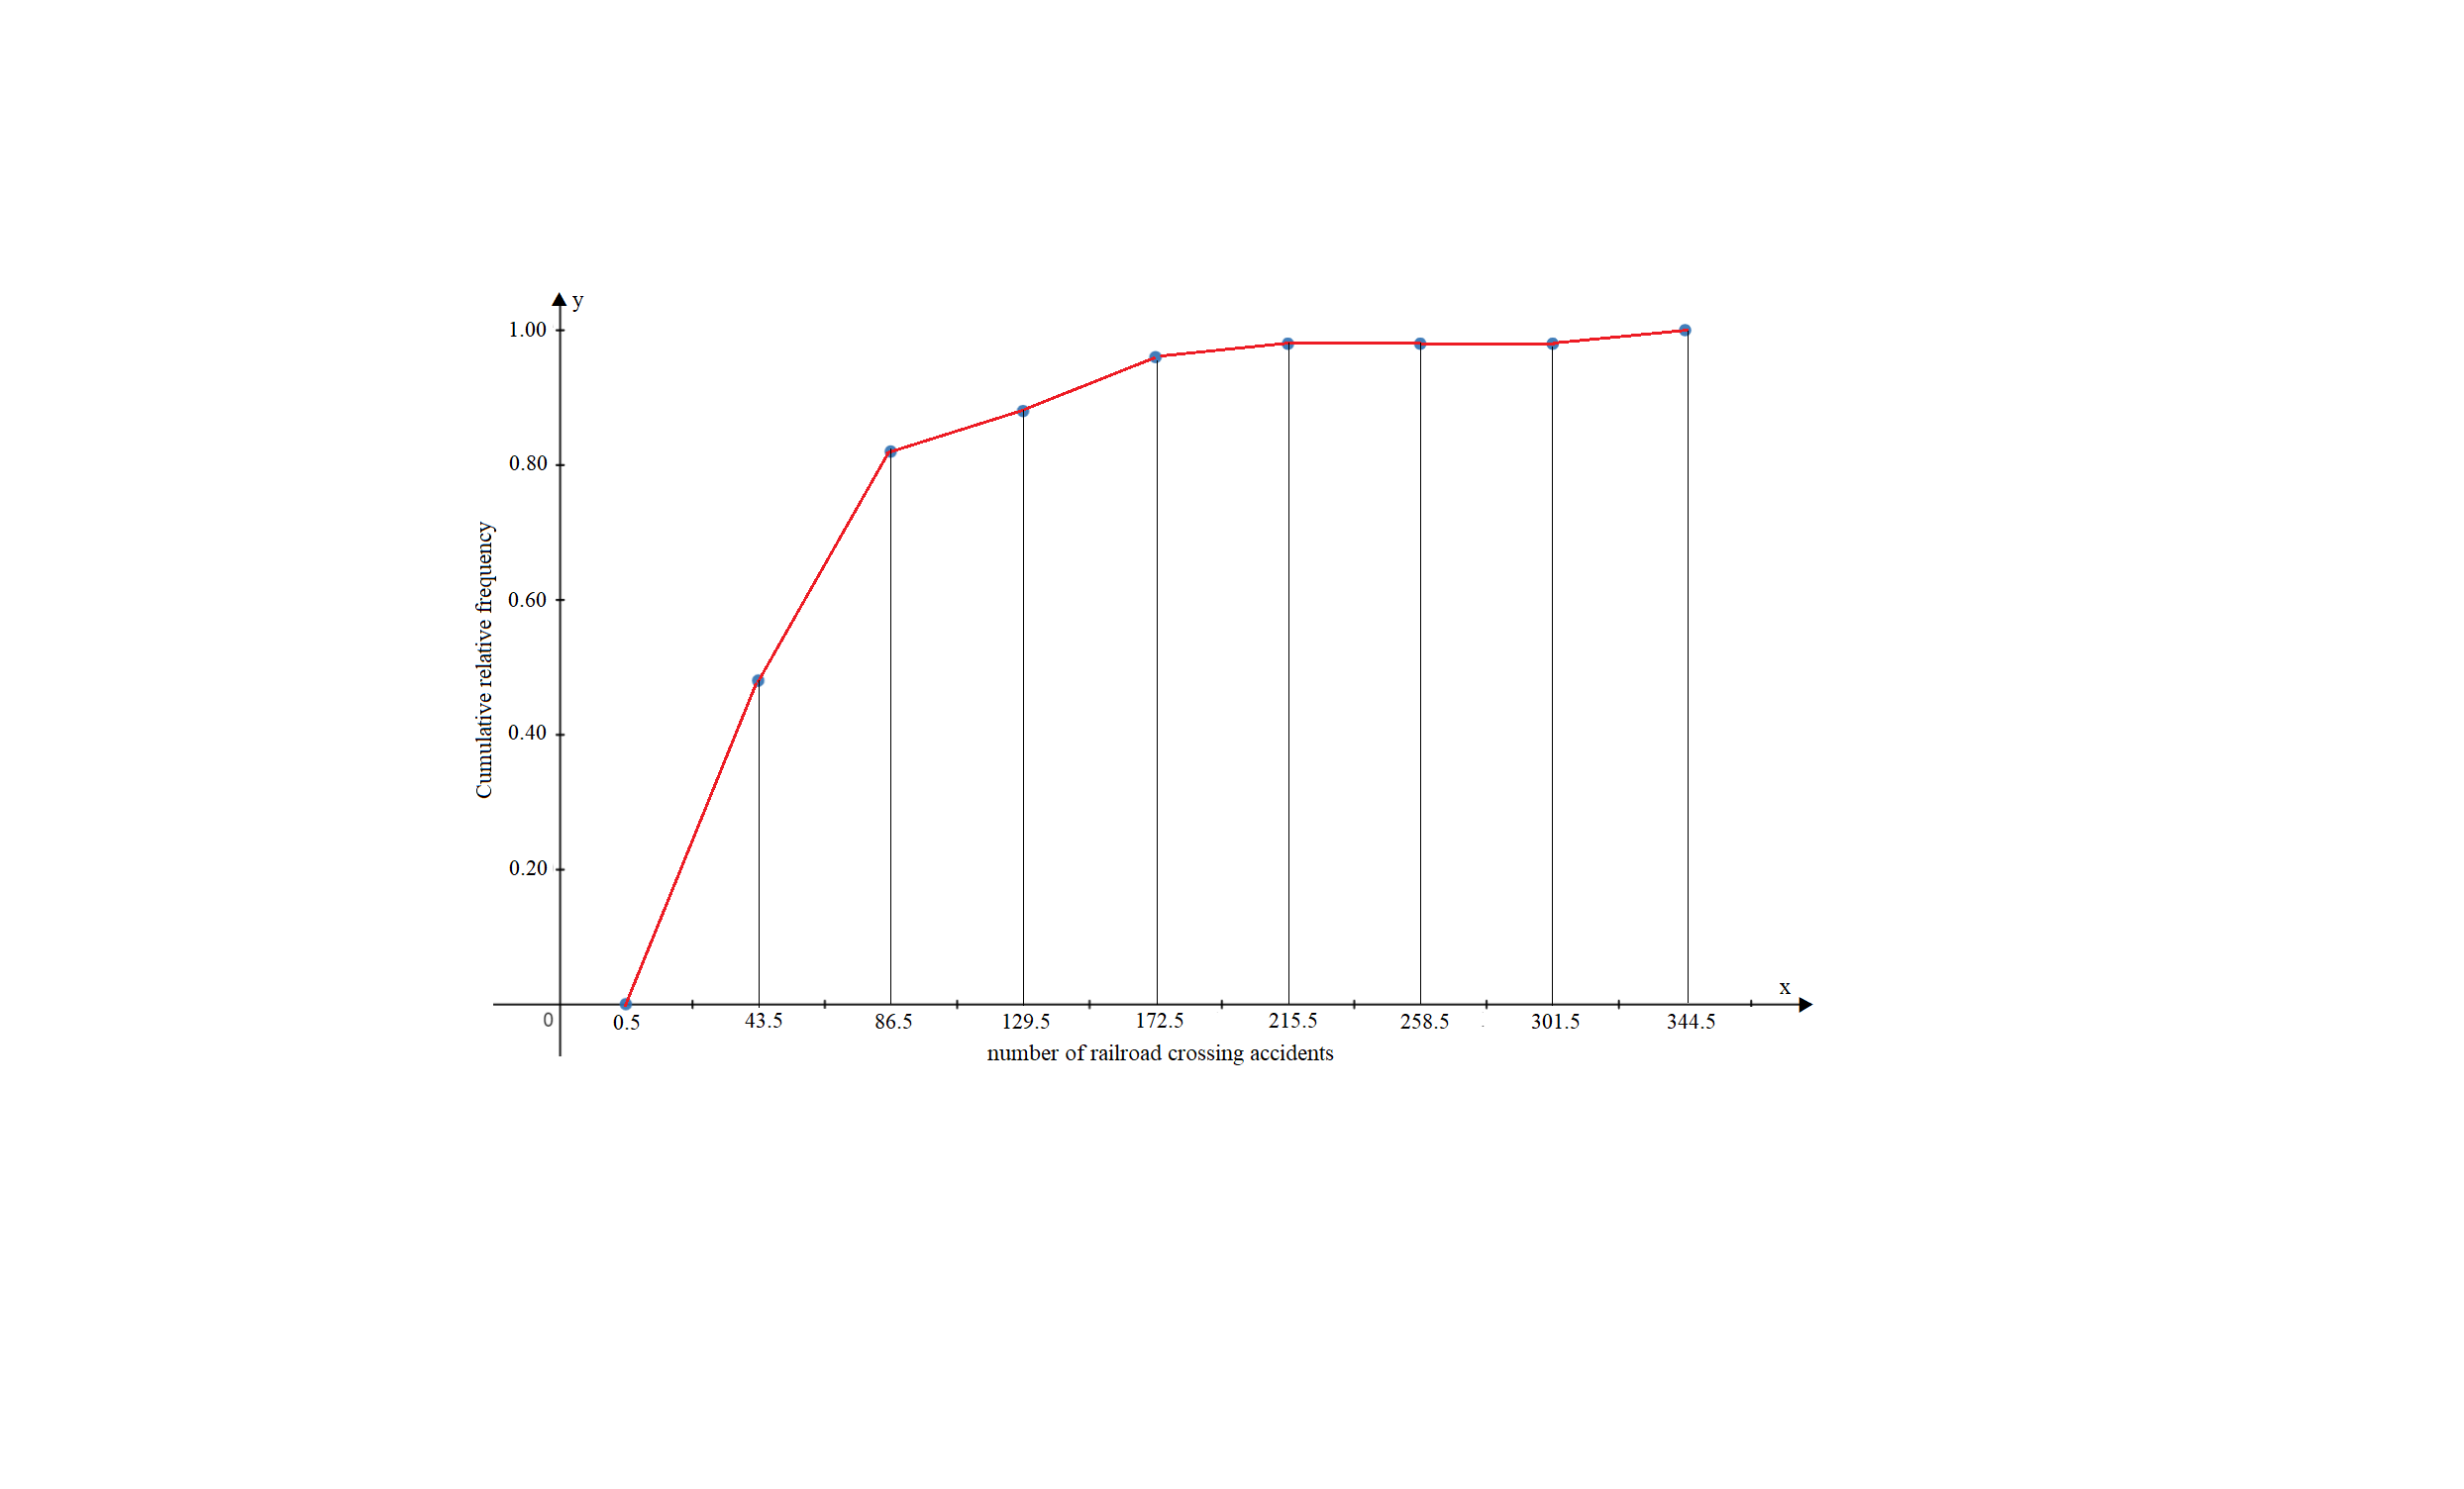
<0.5<43.5<86.5<129.5<172.5<215.5<258.5<301.5<344.5Cumulativefrequency02441444849494950Cumulativerelativefrequency0.000.480.820.880.960.980.980.981.00
Histogram for number of railroad crossing accidents
Frequency polygon for number of railroad crossing accidents
Ogive for number of railroad crossing accidents
Mean>mode. Right-skewed (positive) distribution.


Comments