Solutions
Graphical method is applicable to only those games in which one of the players has two
strategies only. The advantage of this method is that is that it solves the problem relatively
faster.
The graphical method consists of two graphs.
(i) the pay-off (gains) available to player ‘A’ against his strategies and options.
(ii) the pay-off (losses) faced by player ‘B’ against his strategies and options.
The pay-off matrix is given below.
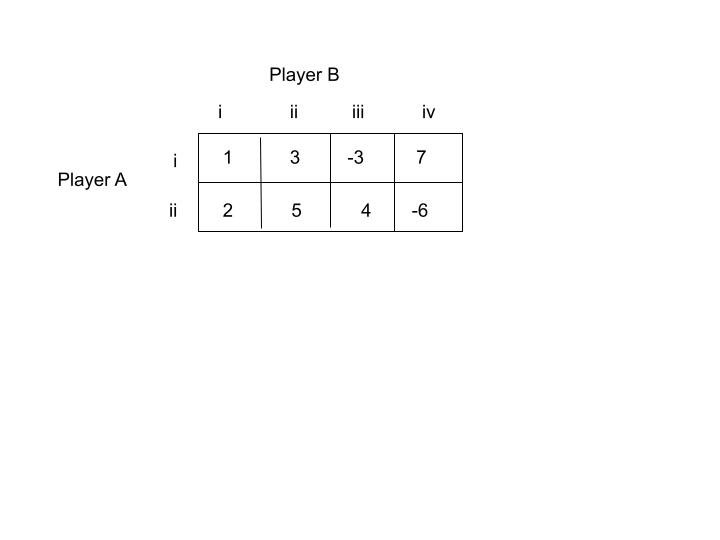
The problem has no saddle point.
∴ There are no pure strategies and mixed strategies are to be adopted.
Player ‘A’ adopts the probabilities xi and xii for strategies 1 and 2. for player ‘B’ the
mixed strategies with probabilities are yi,yii,yiii and yiv respectively. At the optimal level with
the value of the game, as V the following relationship can be established.
xi+xii=1−−−−−−−−−−−−−−−−−−−−−−1yi+yii+yiii+yiv=1−−−−−−−−−−−−−−−−−−2xi+2xii≥V−−−−−−−−−−−−−−−−−−−−−−33xi+xii≥V−−−−−−−−−−−−−−−−−−−−−−4−3xi+4xii≥V−−−−−−−−−−−−−−−−−−−−−57xi−6xii≥V−−−−−−−−−−−−−−−−−−−−−−6yi+3yii−3yiii+7yiv≤V−−−−−−−−−−−−−−−−−72yi+5yii+4yiii−6yiv≤V−−−−−−−−−−−−−−−−−8
The above equations can be written in terms of the player having two strategies.
i.e. in terms of player A.
∴ xii=1–xi
Substituting the value of xii in equations (3), (4), (5) and (6). we get:
Equation (3) can be written as:
xi+2xii≥V∴xi+2(1–xi)≥V⟹V+xi≤2−−−−−−−−−−−−−−−−−−−9
Equation (4) can be written as:
3xi+5xii≥V∴3xi+5(1–xi)≥V⟹V+2xi≤5−−−−−−−−−−−−−−−−−−10
Equation (5) can be written as:
−3xi+4(1–xi)≥V∴4−7xi≥V⟹V+7xi≤4−−−−−−−−−−−−−−−−−−11
Equation (6) can be written as:
7xi−6(1–xi)≥V∴xi−6≥V⟹xi−V≤6−−−−−−−−−−−−−−−−−−12
Player A’s objective is to maximize the value of ‘V’ and to find the combination of xi and xii which gives the maximum value.
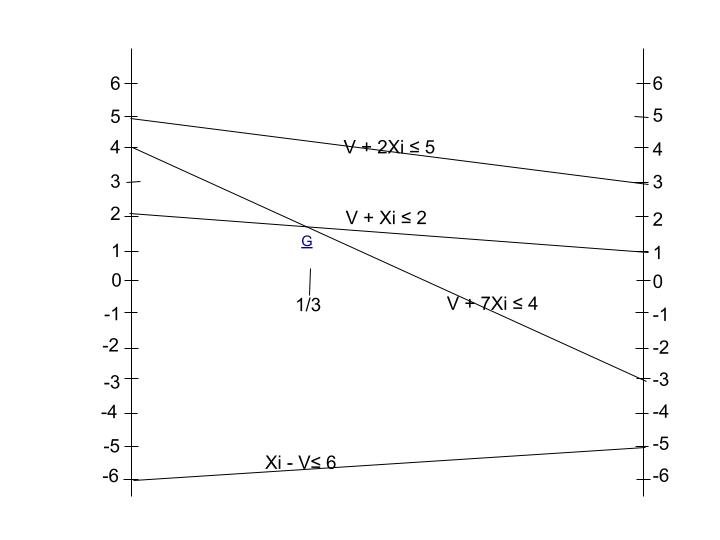
The graph of xi versus V can be drawn with the relationships in equations (8), (9), (10) and
(11) by plotting xi on x-axis and ‘V’ on y-axis. The range of xi is between 0 and 1, and so we
plot the graph within 0 and 1 of xi .
Equation (8) gives,
When
xi=0; V=2xi=1; V=1
Equation (9) gives,
When
xi=0; V=5xi=1; V=3
Equation (10) gives,
When
xi=0; V=4xi=1; V=−3
Equation (11) gives,
When
xi=0; V=−6xi=1; V=−5
Plotting these equations on the graph, as shown below the feasible region is given by the area below AGD.
The maximum value of ‘V’ in this region is given at point G. At this point xi=31 and xii=32.