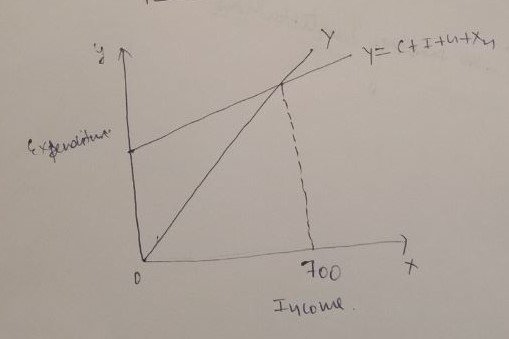
Question #191768

If consumption is C=100+0.75Yd

Taxes is T=50+0.5Y

Export is X=200

Import is M=50+0.25Y

Government spending is G=150

Investment is I=200. Y is domestic income and Y is private disposable income. Illustrate aggregate spending and equilibrium income on a diagram.


Expert's answer

Yd=Y−TYd = Y - TY=C+I+G+X−MY = C + I + G + X - M

Y=100+0.75Yd+200+150+200−50−0.25YY = 100 + 0.75Yd + 200 + 150 + 200 - 50 - 0.25 Y

Y=600+0.75(Y−T)−0.25YY = 600 + 0.75(Y - T) - 0.25Y

1.25Y=600+0.75(Y−50−0.5Y)1.25Y = 600 + 0.75(Y - 50 - 0.5Y)

1.25Y=600−37.5+0.375Y1.25Y = 600 - 37.5 + 0.375Y

1.25Y−0.375Y=562.51.25Y - 0.375Y = 562.5

0.875Y=562.50.875Y = 562.5

Y=642.85Y = 642.85

Now suppose government spending increased to 200. 

Y=100+0.75Yd+200+200+200−50−0.25Y.Y = 100 + 0.75Yd + 200 + 200 + 200 - 50 - 0.25Y.

0.875Y=612.50.875Y = 612.5

Y=612.50.875Y =\frac{ 612.5}{0.875}

Y=700Y = 700

LATEST TUTORIALS
APPROVED BY CLIENTS