solution
Saving function can be derivedfrom the consumption function as follows;
S=f(Y)Y=C+SS=Y−C
thus savings is the amount ofincome not spent in consumption;
therefore;C=C−cYS=Y−C−cYS=−C+Y(1−c)
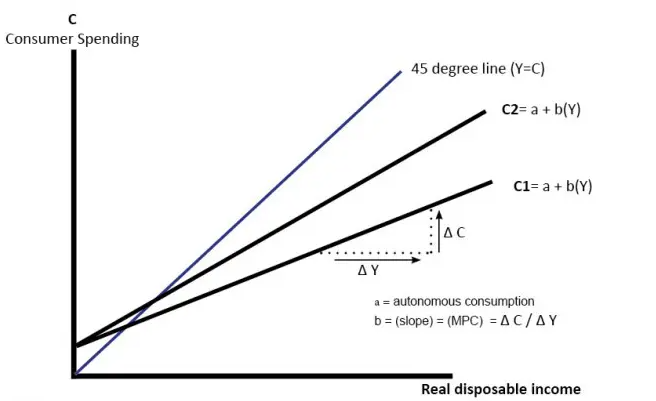
C is MPC
As change in income is devoted either to a change in consumptionor a change in saving or to both, therefore, the two ratios, that is;
[∆Y∆C] and [∆Y∆S] should add up to 1.MPC+MPS=1or 1–MPC=MPS or (1–c) is the MPS
Where MPC represents the slope of consumption curve and MPS (1–c)represents the slope of saving curve.As MPS is positive, therefore, saving is an increasing function of theincome level, i.e., saving increases with increase in income.
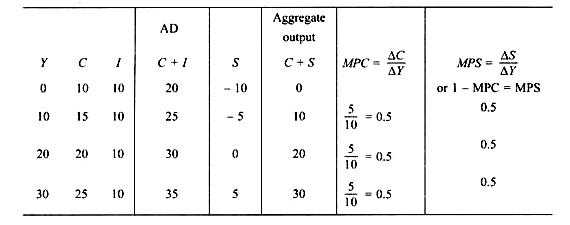
for example
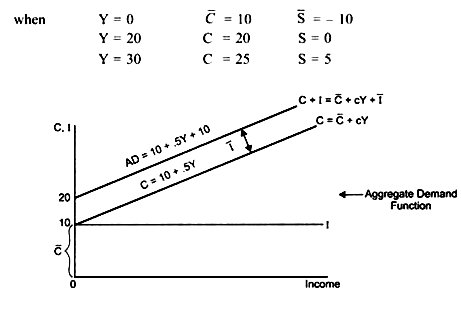
given;
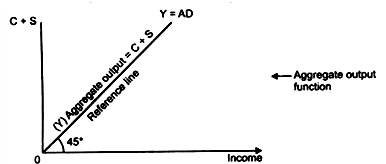
As consumption is directly related to the income level, thereforeconsumption curve is positively sloped.C=f(Y)
AD curve(C+I) is positively sloped. Thegap between the consumptioncurve and AD curve is constant, that is, the two curves are parallelbecause Investment is constant.
Saving curve is positively sloped because saving is directly relatedto the income level.S=f(Y)
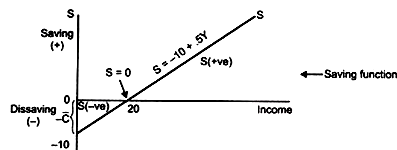
At very low income level there is dissaving.Dissaving implies thatconsumption is greater than the income level. This increased consumptionis met from past savings, therefore ,there will be dissavingin the economy,e.g.Y=10C=15Y=C+S
S=10−15Or,S=−5 →Dissaving